
Boiling frog retracement: How to distinguish whether it is a normal fluctuation or a strategy failure
- 2026年11月3日
- Posted by: Eagletrader
- Category: News
The most torturous thing in the trading world is not the sudden liquidation, but the continuous retracement like boiling a frog in warm water.
When a strategy that has worked well in the past suddenly fails continuously and the net value of your account drops all the way, you will often find yourself in a dilemma while sitting in front of the screen:
If you stop too early, you may cut just before dawn and miss the self-repair of the strategy; if you continue to persist, you may mistake the real strategy failure for normal fluctuations.
So, when continuous losses occur, how should we judge: The current trough is just a normal fluctuation that the strategy should withstand, or is this method really on the verge of failure?

Normal retracement is originally part of the strategy
No trading strategy can be profitable all the time.Even if a system has positive performance over the long term, it may suffer several or more losses in a row.
As long as these results are still within the range of fluctuations that the strategy may have originally experienced, the strategy cannot be immediately judged to be invalid because of poor short-term performance.
For example, a trend strategy itself relies on a few larger trend trends to cover multiple small stop losses.So the continuous losses during the shock stage are not surprising in itself.
The core characteristic of a normal retracement is that the result has become worse, but the original operating logic and fluctuation range of the strategy have not changed significantly.
Is it because the strategy failed, or did you perform the transformation?
Many times, traders think that “the strategy has stopped working recently”, but when they look back at their trading records, they will find that what has really changed is the execution method.

I was originally supposed to wait for confirmation before entering the market, but recently I started placing orders in advance;
The originally fixed position was enlarged due to the rush to recover capital after continuous losses;
The trades that should have been stopped were continued because they were unwilling to accept losses.
If the transaction is different from the original rules, this loss cannot be used to judge whether the strategy is effective – because what you are testing is no longer the original system.
Wrong implementation of the strategy and failure of the strategy are two completely different things.
Look at the environment: Has the market style changed?
Many trading strategies have their own “comfort zone.”
Trend strategies usually prefer market trends with clear directions and strong sustainability; while some strategies that favor shock logic may experience a significant decline in performance when one side runs quickly.
When a strategy suddenly enters a retracement period, we need to observe: Does the recent market environment still meet the conditions for this strategy to exert its original advantages?

If you just temporarily enter a stage that is not suitable for you, the strategy may not be ineffective;
However, if the market structure changes in the long term and the core logic relied on by the strategy continues to fail to work, a serious re-evaluation is required.
Look at the data: Don’t draw conclusions based on a few losses, lengthen the sample period
This is one of the most common mistakes: if you lose three times in a row, you will think that the system is no longer working; if you make a few profits in a row, you will think that the strategy is very effective again.
But when the sample is too small, the results are easily affected by randomness.To judge the status of the strategy, you need to lengthen the period and look at a complete trading sample.
For example, compare recent changes in winning percentage, average win-loss ratio, number of consecutive losses, and overall drawdowns with historical long-term data.
If only a certain indicator deteriorates in the short term, it is not enough to prove that the strategy is invalid;
What is truly alarming is that multiple core indicators continue to deviate from past normal levels, and this change cannot be explained by market conditions or execution issues.
At this time, you should pause and retest, instead of simply telling yourself “it’s just a normal retracement.”
Set standards: Set “risk control lines” in advance, don’t rely on emotions
The main reason why it is difficult to distinguish between normal retracement and strategy failure is that it is difficult for people to remain completely objective after a loss occurs.
The more you lose, the easier it is to fall into the two extremes of “blindly carrying on” or “frequent denial”.
So a better way is to set re-evaluation criteria in advance when the strategy is in good shape.
For example, when the retracement clearly exceeds the common historical range, or the core data continues to deteriorate in sufficient samples, trading is suspended and the strategy is rechecked.
Instead of waiting until you lose money to decide whether to persist, you should know in advance where the order should persist and the red light should turn on.
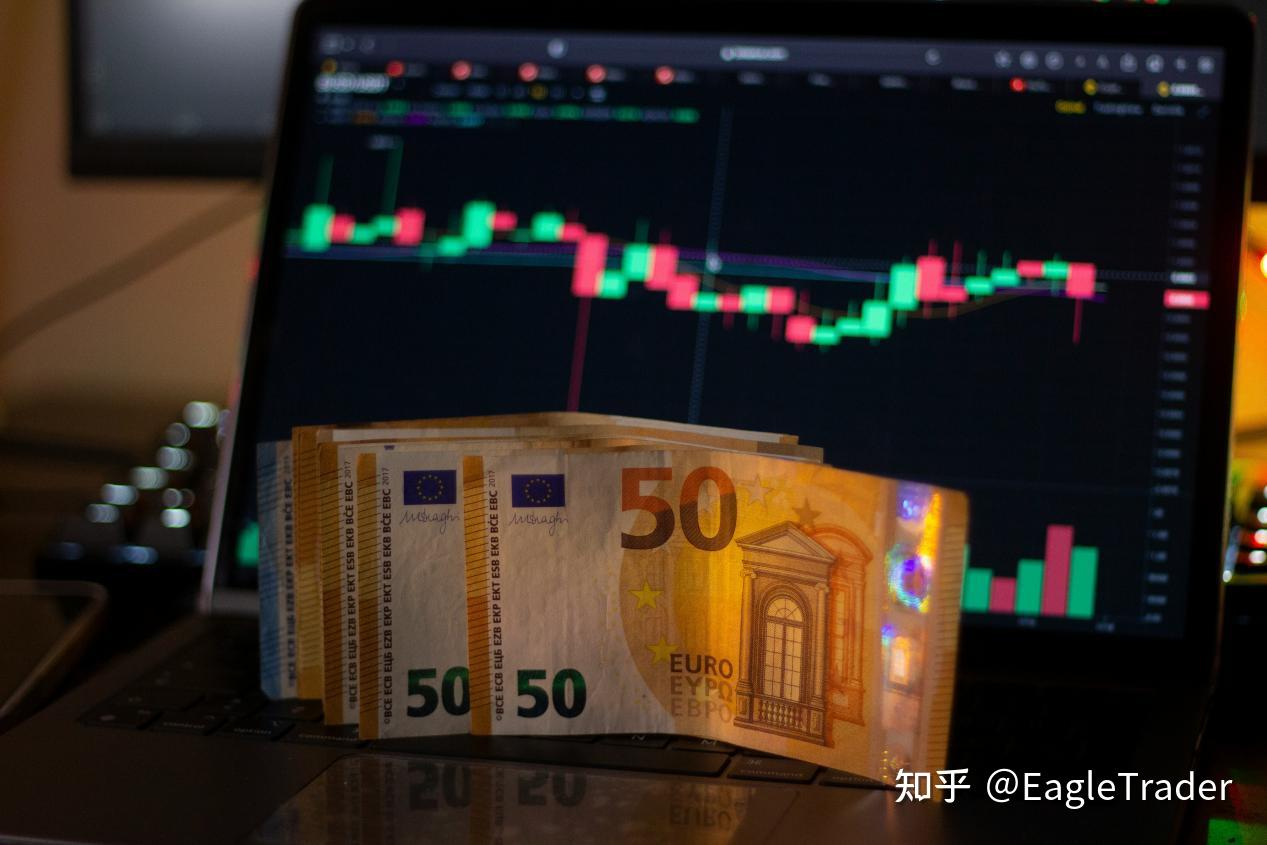
First reduce the trial and error cost of real funds
Determining whether a strategy has retraced normally or has failed requires time and samples.
If personal funds are used directly for the entire verification process, the cost of each trial and error will be reflected in your principal simultaneously.
Faced with the psychological pressure of real capital losses, judgments that should have been based on data can easily be biased by fear or eagerness to recover capital.
If the more important goal at the moment is to continue observing the strategy, then a demo account can provide another space for verification.
Traders can continue to execute according to the original system, accumulate more samples, and then judge whether the current situation is just a period of incompatibility, or whether the core logic has really changed.
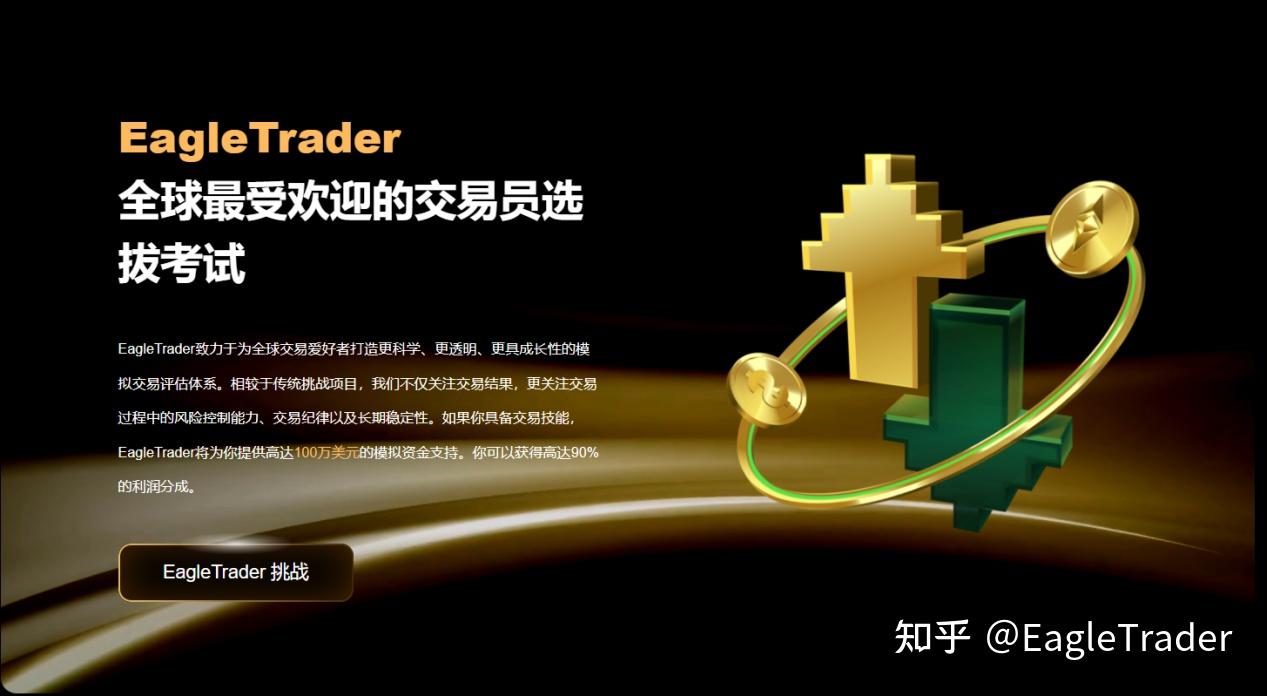
This is also a value that EagleTrader’s proprietary trading model can provide.
EagleTrader allows traders to continuously verify their trading performance under clear risk rules through simulated accounts.
If you choose Max mode, you can also save multiple rounds of profit target assessments and directly enter the trading stage after obtaining an account.
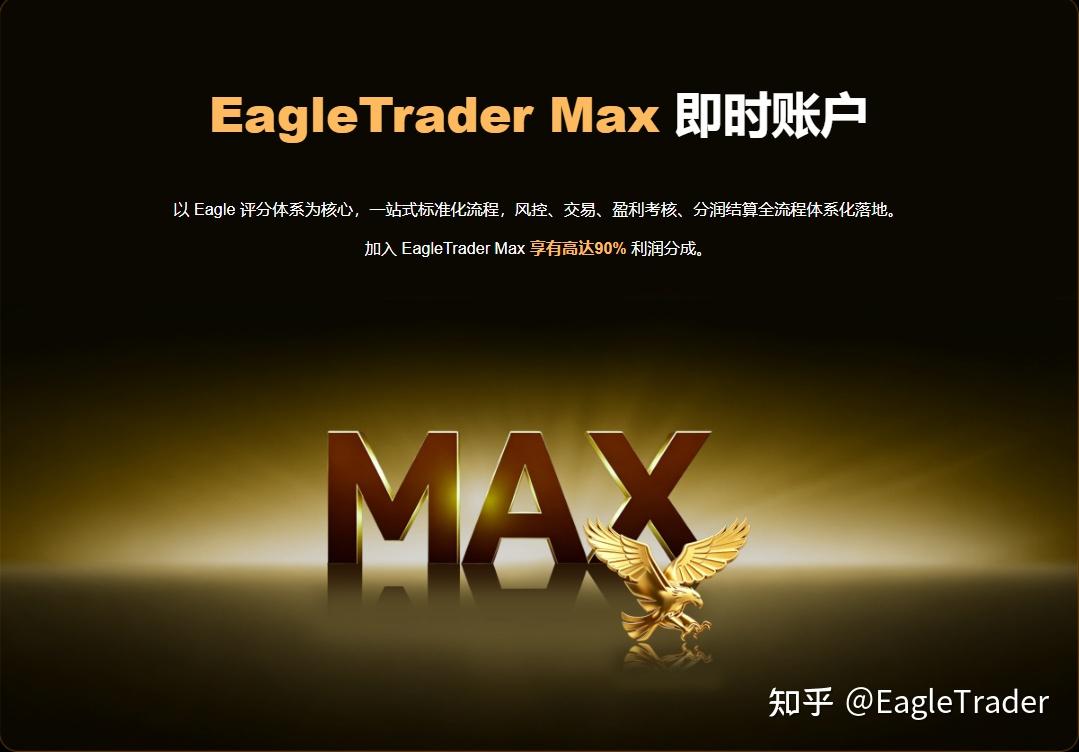
When the account meets the corresponding Eagle score, number of transactions, profit consistency and cycle requirements, eligible transaction profits can receive profit sharing rewards at a rate of up to 90%.
Simulated trading is therefore not just a “practice” but can also be a way to observe strategies, verify execution, and be incentivized for trading performance that meets the platform’s requirements.The retracement is not scary, the scary thing is being blindly taken over by emotions.
Therefore, finding the reasons is more important than rushing to make a decision.Replacing feelings with data is the beginning of trading becoming mature.
Risk warning: This article is only for trading knowledge and EagleTrader model introduction, and does not constitute any investment advice, income commitment or trading result guarantee.
Simulated trading performance does not represent actual future results. Specific account rules, profit sharing conditions and reward ratios are subject to the latest official announcement by EagleTrader.