ET Sharing | Four-step trend filtering method: Help you solve 90% of invalid trading opportunities
- 2026年5月22日
- Posted by: Eagletrader
- Category: News
What is the most difficult thing in trading? It is not finding the entry point or setting a stop loss, but controlling your hands and not making junk moves that look like opportunities. 90% of the losses in the real market are caused by the fact that they knew that the market was rough and the direction was unclear, but they still couldn’t help but open a position, and in the end they were repeatedly stopped, which consumed funds.
The four-step trend filtering method shared by EagleTrader today breaks down the way professional traders judge trends into four simple steps, helping you establish clear trading criteria and filter out the vast majority of impulsive transactions that make you lose money.
We uniformly use the 1-hour chart for trend filtering and the 15-minute chart to find specific entry points. All judgments are made on the 1-hour chart. As long as one step is not met, the transaction will be abandoned directly without any exceptions.

Four-step method of trend filtering
To determine whether a trend is worth pursuing, ask yourself these four questions in order. If the answers are all “yes”, then consider opening a position.
Step one: Determine the direction first and only do one side
There are many ways to determine the direction, such as order flow and winding theory, but the most friendly to novices and the least error-prone is the moving average.
The three moving averages commonly used are EMA20, EMA60 and EMA120: when EMA20 is above EMA60 and EMA60 is above EMA120, and the three lines move upward at the same time, it is a clear bull trend. At this time, only long positions are considered; conversely, when the three lines are downward at the same time, only short positions are considered.
This step is non-negotiable. Don’t think “it’s time for a rebound after falling so much” to buy the bottom, and don’t think “it’s time for a correction after it has risen so much” to find the top. If the direction is wrong, no matter how accurate the entry is, it will be wrong.
Step 2: Look at the stage again and don’t take the last shot
You can’t buy indiscriminately even if the direction is right. If you buy when the trend is about to end, you will still lose a lot of money. In this step, use MACD to see if the trend shows any signs of “not moving”, which is what everyone often calls a divergence.
<img alt="" src="https://www.hudianbaoseo.cn/uploads/allimg/20260522/1779415103112905.jpg" width="654" height = 384 Look at the peaks formed by MACD above the 0 axis (that is, the highest point before each dead cross), mark them out, and mark the corresponding K-line price high points;
Connect the MACD wave peaks with a line, and the K-line price high points with a line. If both lines are going up, it means the trend is healthy; if the K-line is still making new highs, but the MACD peaks are lower than the other, it is a top and back. It means that the trend is coming to an end and you must not chase it.
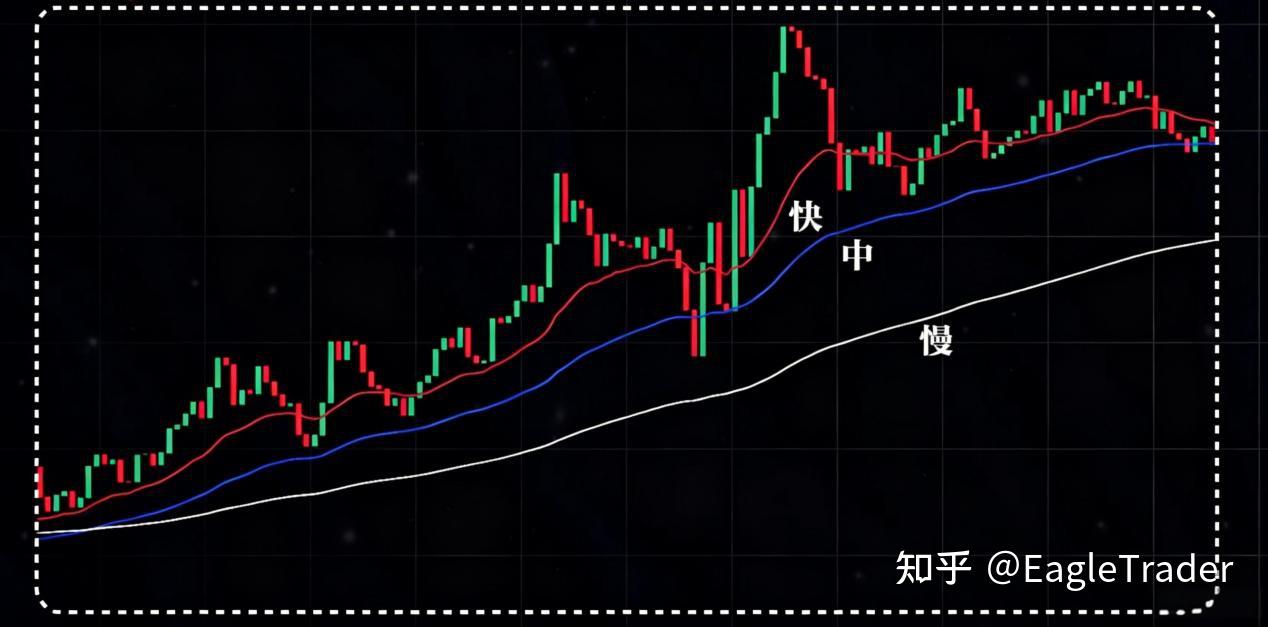
Step 3: Evaluate the energy and only do simple market movements.
It is also a rise. Some markets rise cleanly, and some markets rise slowly. We only do the former, and the latter is essentially a shock, and we will only be swept back and forth.
Judge the energy by looking at two things: K-line shape and overlap. Divide the trend into two types, and only do the first one:
1. Strong trend: Most of the K lines are big positive lines/big negative lines with full entities, with few upper and lower leads, and there is almost no overlap between K lines. This kind of market is driven by big funds and has the best continuity;
<img alt="" src="https://www.hudianbaoseo.cn/uploads/allimg/20260522/1779415103486956.jpg" width="654" height = 323 Just give up on this market and wait patiently for it to take a clear direction.
Step 4: Confirm the level and take big risks without making small money
Whether you are doing a large-level main trend or a small-level rebound directly determines how much money you can make and how long you should take it. Many people are unable to hold orders because they regard a small rebound as a big trend.
It is very simple to judge the level. You still need to look at the relationship between MACD and the 0 axis (the downward trend can be reversed):
Small level rebound: MACD moves downward from above the 0 axis. It turned upward again before hitting the 0 axis. The profit margin of this market is small, and it is not worth taking a heavy position;
Same level trend: MACD just stepped back to the vicinity of the 0 axis, and then continued to move upward. This is the most ideal market, and the profit margin is large enough, so you can place it.Xinna;
Large level trend: MACD fell below the 0 axis, stayed underwater for a period of time, and then climbed back above the 0 axis. This kind of market adjustment has been fully adjusted, and there will be greater room for growth in the future.
Remember one principle: only follow trends of the same level and large levels. Just look at the rebound of small levels. There is no need to take risks.
Many people think that trading requires diligence and trading every day. But in fact, there are only a few transactions a month that can really make money. The purpose of this four-step method is to help you block out all the messy market conditions, so that you can only take action when you are most confident.
When you can watch the market rise, but can calmly say “This does not meet my standards, I won’t do it”, you have surpassed the vast majority of retail investors.