Have you been deceived countless times by fake breakthroughs? EagleTrader uses market contours to teach you how to distinguish the real from the fake at a glance.
- 2026年5月12日
- Posted by: Eagletrader
- Category: News
Do you often stare at the K-line chart, but always feel that you cannot grasp the context of the market? It is easy to be biased by market fluctuations by simply looking at up and down signals. What can really give you an advantage in trading is understanding the flow of funds behind the market – where are institutions making arrangements and where are prices more likely to reflect fair value?
EagleTrader will share a tool to help you visualize the “underlying logic” of the market: Market Profile (MarketProfile). By mastering it, you can turn the market information one hour before the opening into the most valuable trading reference.
What is market contour?
Market contour is not a traditional technical indicator such as moving average and RSI, but a unique data organization and visualization method.
K-line chart: only shows price fluctuations. Market Analysis: Graphically tell you how long the market has stayed at each price and where there is real enthusiasm for transactions. By showing the buying and selling process of the market in real time, you can tell at a glance: where the market finds balance and “fair value” (both buyers and sellers are satisfied), and at which prices it is quickly rejected.
On modern trading platforms, market contour (a measure of time) is often closely related to its twin brother, volume distribution (Volume Distribution).
Profile, which displays the actual contract volume in a bar chart). The combination of the two perfectly reveals where the patience of the market and the deployment of real money by institutions intersect.
The composition of the market profile
The market profile does not use traditional K lines, but is composed of a basic unit called TPO (time price opportunity). These TPOs are presented in the form of letters on the chart.
To understand it, you need to look at how the outline is “constructed” throughout the day:
Each TPO usually represents
30-minute trading period (you can set it yourself on the platform, but 30 minutes is the most common standard). The range of each TPO corresponds to the price fluctuation range from high to low within the half hour. The first half hour after the opening is represented by the letter A. During these 30 minutes, no matter where the price moves, the platform will mark a row of A’s (or colored squares, depending on the platform settings). After half an hour, it enters period B, and the platform begins to draw B at the price position. By analogy (C, D, E…), the standard daily outline consists of approximately 46 to 48 such TPO blocks.
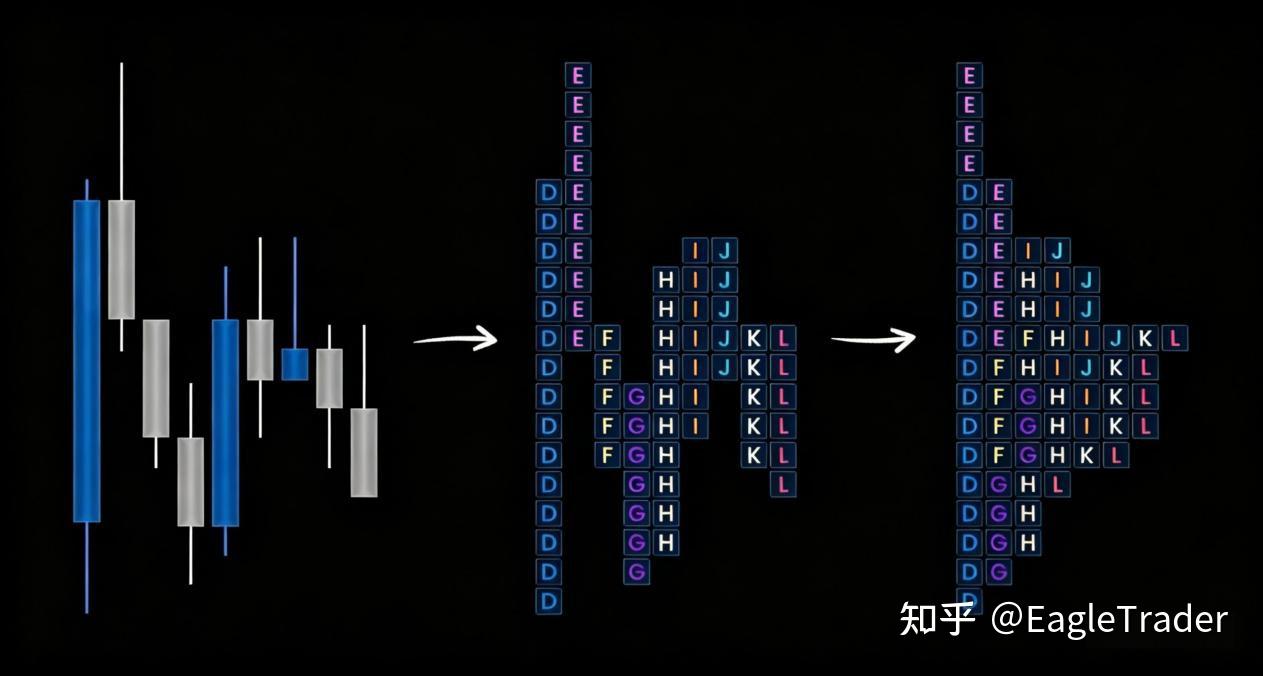
When all half-hour periods are “pressed” onto the same vertical axis from left to right, the final daily outline is formed. Most contours naturally exhibit a bell-shaped curve (Gaussian distribution). The widest middle section reflects the price that buyers and sellers are most satisfied with, while the narrower areas at the ends represent where prices are excluded.
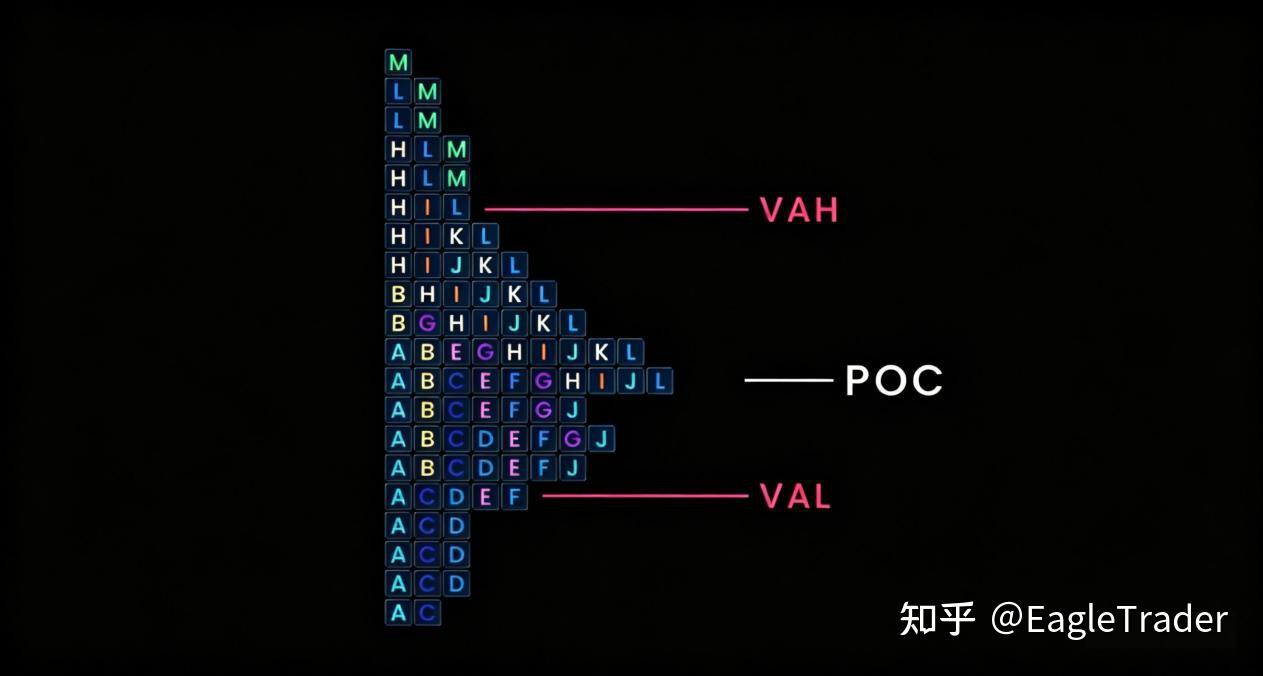
Value Area and Control Point
The core of each contour is the Value Area (VA). Based on the principle of normal distribution, VA frames the range in which 68.2% of the trading activities occur in a day.
For traders, this is the comfort zone of “fair value.” onceWhen price leaves this area, an imbalance occurs.
You need to keep an eye on several key structural points:
POC (Point of Control): the absolute center of gravity throughout the day. It is the point where the outline is widest and is where the letters/half hour stack up the most, meaning trades stay there the longest. VAH (value area upper edge): the top boundary of fair value. VAH acts as natural resistance when price is inside VA. If the price only temporarily breaks through VAH, institutions will believe that the market is overvalued, and aggressive selling will usually step in to push the price back to the value zone. However, if there is a clear breakthrough, it means that the bull trend has begun, and the original VAH will immediately turn into support. VAL (lower edge of value area): the bottom boundary of fair value. When price is within VA, it is natural support. A brief fall below VAL indicates that the market is temporarily undervalued (oversold), which is an extremely attractive opportunity for buyers to return to fair value. However, if the price breaks through VAL strongly, the short trend is confirmed and the original support (VAL) will become resistance.
Initial Balance
If you take away only one practical concept from the introduction to market outline, it must be Initial Balance (IB).
It refers to the extreme highs and lows created by the first two TPOs (i.e. Period A and Period B) after the opening of the main period, which is the fluctuation range formed in the first hour of trading.
Why is the initial equilibrium so important, both statistically and psychologically?
It reveals the intention of the institution (setting the tone of the day). From the range of the first hour, you can roughly judge what kind of market is likely to develop in the next day.
If IB is very narrow, it means that there is no consensus in the first hour of opening, there is a lack of liquidity, and the market is ready to go. This narrow range is likely to be broken by a strong trend, turning into a strong trend day, and the price never returns to the center.
If IB is very wide, it means that the market has almost stretched the range (from top to bottom) as soon as it opened. The rest of the day will most likely be “shocky”, with prices slowly grinding from one side of IB to the other.
Now you have mastered the basic mechanical logic of the market, the principles of value creation, the composition of the outline, and you also understand how to keep a close eye on the rate of return in the first hour of opening.
As for how the market opens and how it forms a specific intraday structure with the initial balance, EagleTrader will continue to dismantle it for you in the future. If you are interested, please follow us!