
Trading always loses money before reversal? 3 signals teach you to stop and wait and see
- 2026年8月3日
- Posted by: Eagletrader
- Category: News
In a complete trading system, the timing of entry determines the profit margin, and the exit and short position strategies determine the safety of the principal.
The market trend changes rapidly, and the rising structure often breaks earlier than most people perceive. Blindly holding or buying the bottom against the trend can easily cause a sharp retracement.
For mature traders, being able to identify high-win entry opportunities and understand high-risk stop signals is an essential ability for stable profits.
Today EagleTrader has compiled three clear “stop signals” on the market for your reference to control trading risks and optimize short position decisions.
<img alt="" src="https://www.hudianbaoseo.cn/uploads/allimg/20260803/1785726872143178.jpg" width="654" height = 343
Once it is established, it means that the internal driving force for the rise may have exhausted, and the risk of reversal is extremely high.
Look at this case. This is a clear upward trend. Most people’s first reaction is to look for opportunities to go long on dips. But let’s not rush. Use the 123 rule to see if the trend has reversed:
Step 1: The price falls below the upward trend line, which means that the upward slope is destroyed.
Step 2: The rebound failed to reach a new high, and the price rebound was weak and failed to exceed the previous high, which shows that the power of the bulls is beginning to fail.
The third step: the price falls below the previous low, this is the most critical step. It confirms that the market structure has changed from “higher highs, higher lows” to “lower highs, lower lows” and that the embryonic form of a downtrend has emerged.
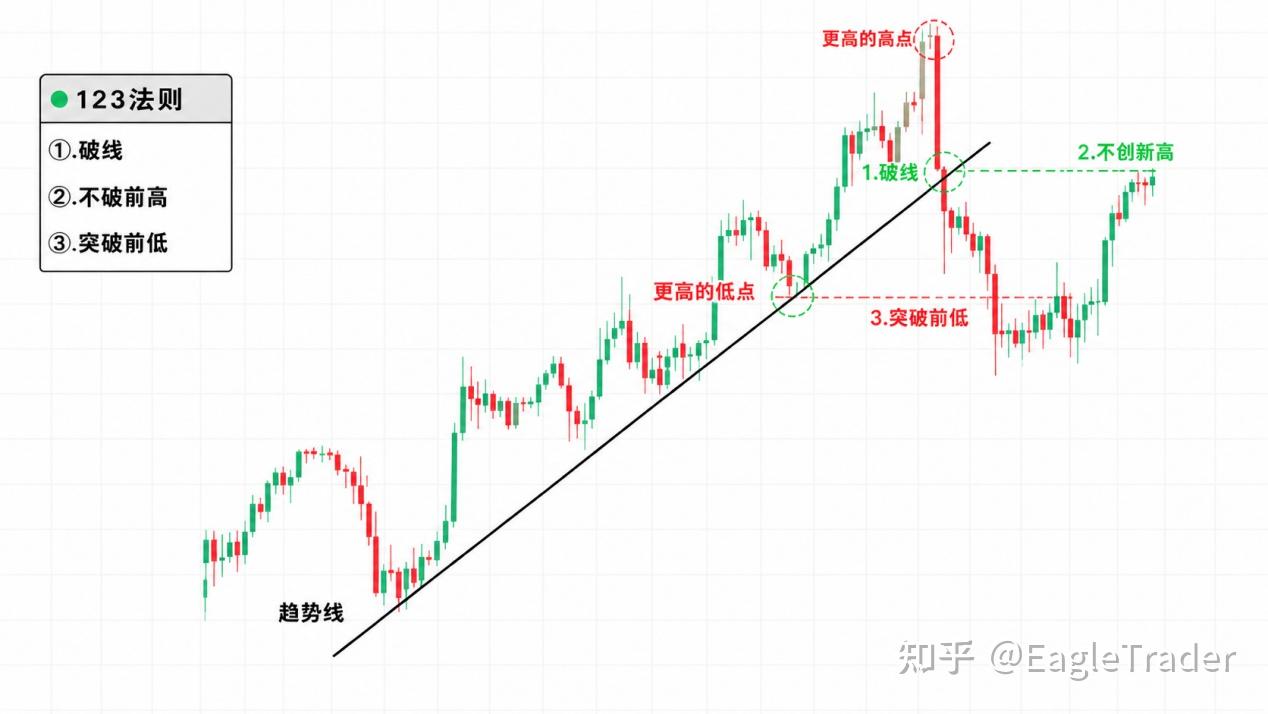
When all the above three steps are met, the original rising structure has been destroyed. At this time, any idea of going long on dips is extremely dangerous.
Does the one-two-three rule hold true, which means that you can go short immediately? Not yet.
Because the reversal of the trend requires a process, a more prudent approach is to wait for the market to clearly emerge from a new downward structure, such as lower highs and lows, and then follow the new trend to find short-selling opportunities.
MACD has a top divergence, and the upward momentum is exhausted
Please note that this is a divergence, not an ordinary divergence.
If MACD has a top divergence, it usually means that the inherent momentum of the entire upward trend has been exhausted to the extreme, and the probability of reversal is extremely high.
How to judge the divergence? There are three steps:
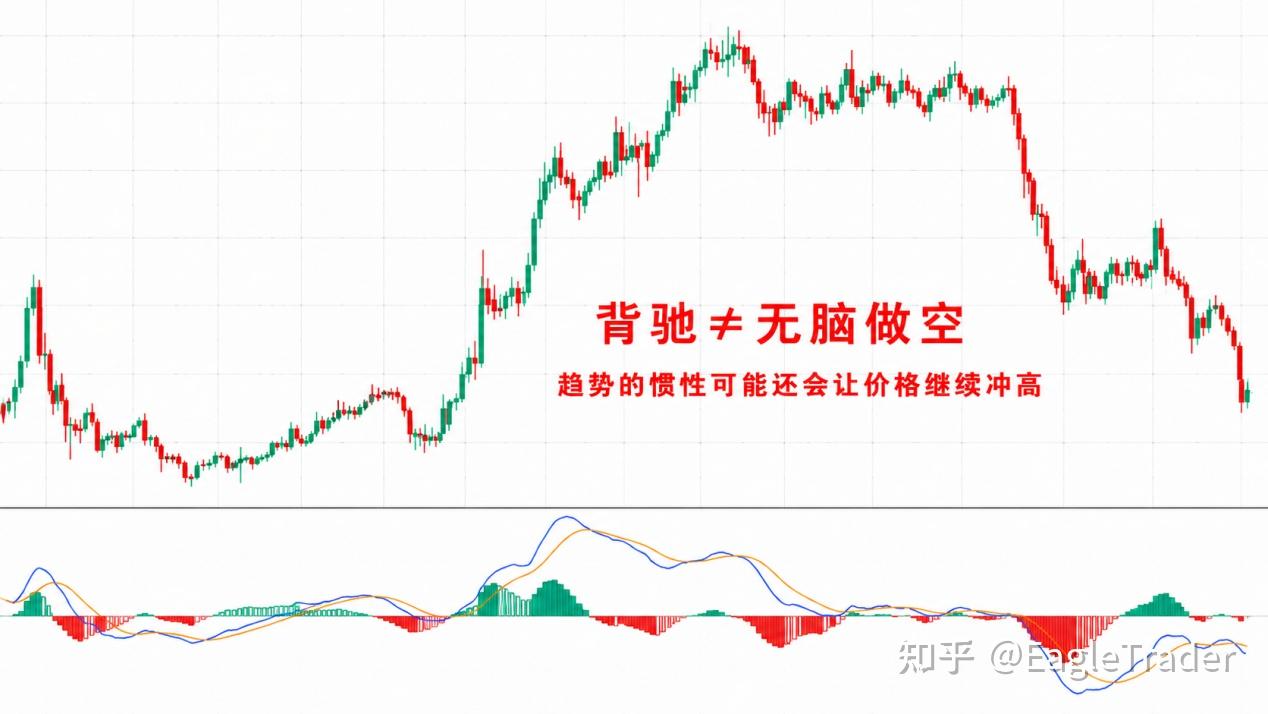
The first step: define the trend segment. Find the starting point and current high point of this round of upward trend on the chart. The starting point is usually the lowest point before MACD crosses the zero axis. We use this to frame the analysis range.
Step 2: Mark extreme points. Find out several obvious high points created by the K line in this trend, as well as several peak high points corresponding to the MACD indicator.
Step 3: Compare and verify divergence. Connect the several high points of the K line, and you will find that the price is still reaching new highs; but at this time, if you connect the several peak high points corresponding to the MACD, you will find that the peaks are lower than the last. This phenomenon of rising prices and shrinking volumes is called divergence.
The price below is still reaching new highs, but the kinetic energy column and the peak of the fast and slow line of MACD are declining, forming an obvious top divergence. Although the market fluctuated for a period of time, it eventually plummeted.
It is worth noting that it is not recommended to go short immediately after discovering the divergence, because the inertia of the trend may cause the price to continue to rise, but it is definitely a clear signal: stop going long and prepare to leave.
The moving average system wraps around or the shorts diverge
The moving average is a trend navigator and can very intuitively tell us the general direction of the current market. When the fast line is at the top, the middle line is in the middle, and the slow line is at the bottom, the three lines are arranged in a long position, which indicates that the upward trend is healthy and beneficial.
When the three moving averages begin to twist together like twists and lose their clear order, it means that the market has entered a volatile range of long and short melee, and the trend is unclear.
Although the moving average has a lag, it is very effective in identifying this kind of garbage time with unclear direction. The best strategy at this time is to stay on the sidelines and wait for the direction to become clear again.
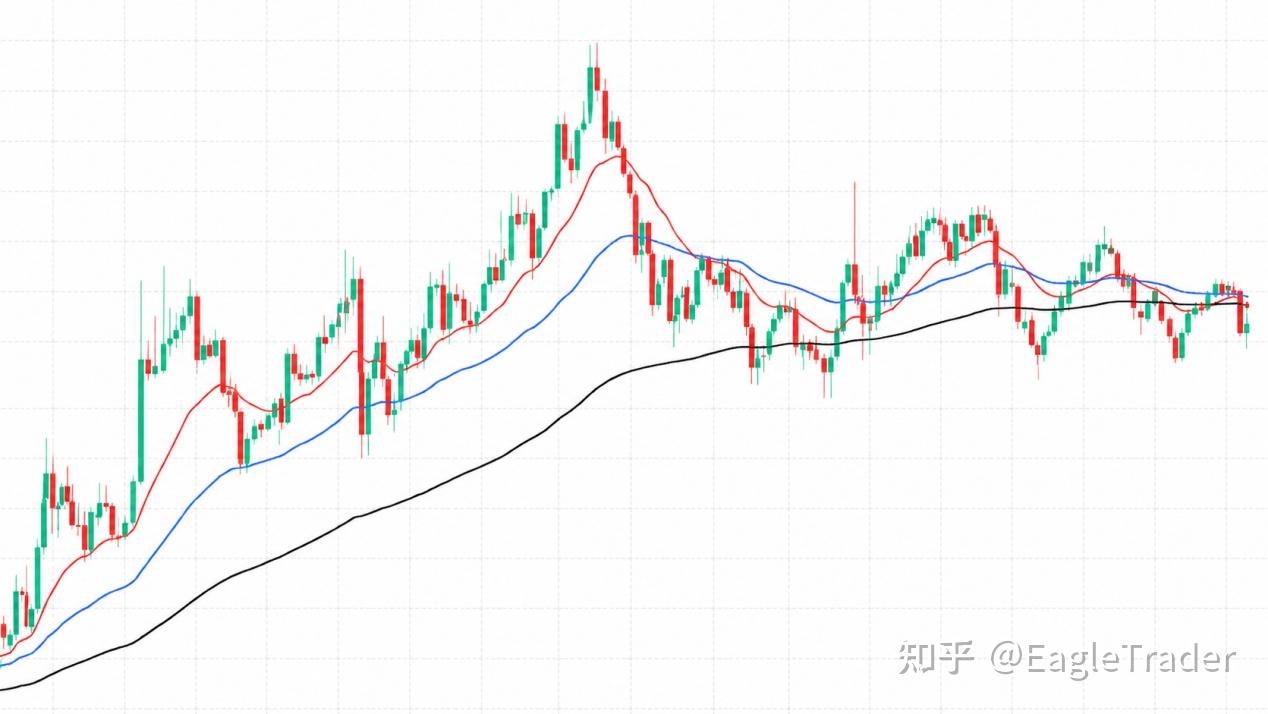
When the moving average further evolves from the wrapping state to the slow line at the top, the middle line in the middle, and the fast line at the bottomThe short position arrangement is already a very clear downward trend signal. The moving average system is telling you that the wind direction has changed and you should not have any illusions about going long.
The above three signals are essentially “trend momentum warnings” issued by the market: the 123 rule confirms that the upward structure has broken, MACD’s top divergence indicates that bulls have exhausted their power, and the entwining of the moving average indicates that the direction has entered a period of chaos.
When one of the three appears, you should tighten your positions and operate with caution; when multiple signals resonate, short positions and wait-and-see are the best choice.
Fighting against the instinct of fear of missing out and sticking to trading rules may seem like you have missed part of the market, but in fact it will help you avoid most traps.
The market will never lack new opportunities, but only those who can retain their principal and wait patiently for high-certainty market conditions will make it to the end.