Why do some people catch the reversal in the same cross star pattern, while others stop losses continuously?
- 2026年6月30日
- Posted by: Eagletrader
- Category: News
In technical analysis, Doji is one of the earliest K-line forms that many traders come into contact with.
Some people regard it as a signal of market reversal, and they are eager to enter the market as long as a cross star appears on the market; others find that it is also a cross star, and sometimes the price does reverse, sometimes it only pauses briefly, and then continues to run along the original trend.
The reason for this difference is not the cross star itself, but the location where it appears and the market environment at that time. In this issue of EagleTrader, we will take you to re-understand the market information that Doji really wants to convey from three perspectives: position, form and confirmation.
<img alt="" src="https://www.hudianbaoseo.cn/uploads/allimg/20260630/1782783221236531.jpg" width="654" height = 343
It reflects that the long and short parties have temporarily entered a relatively balanced state after a round of games. It should be noted that this balance does not mean that the market will definitely reverse, nor does it mean that the trend has ended.
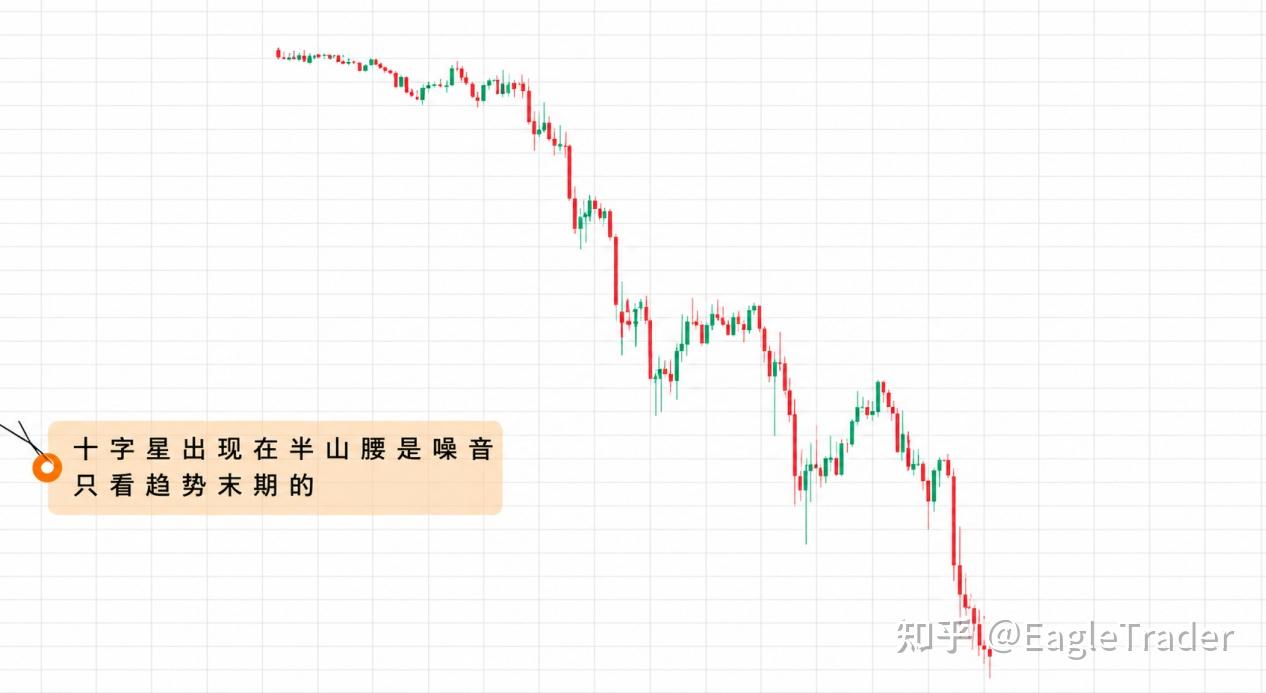
If you are separated from the market background and only rely on a cross star to judge the buying and selling direction, it is easy to mistake ordinary fluctuations for trading opportunities. Therefore, the first step in judging the cross star is not to study the graphics, but to judge the position where it appears.
Step one: Where does the cross star appear?
Compared with the middle of the trend, the cross star that appears at the end of the trend usually has a higher reference value.
For example, when the price continues to rise, the market momentum gradually weakens. At this time, if the MACD top divergence, important pressure levels and other factors are combined, and a cross star appears again, it means that the upward force may begin to slow down; conversely, when the price continues to fall, and a cross star appears along with the MACD bottom divergence or an important support area, it means that the bearish power may be weakening.
Of course, MACD is only one of the auxiliary judgment tools and is not the only standard. Trend structure, support and pressure levels, and changes in trading volume can also help traders determine whether the current market has entered a key position. In other words, position determines whether a Doji is worthy of attention.
Step 2: ObserveThe cross star itself
When the position meets the conditions, let’s look at the shape of the cross star. Generally speaking, a cross star with a longer shadow line will have a higher reference value.
For example, a cross star with a long upper shadow line appears at the end of an upward trend, indicating that the price has tried to continue to break upward, but eventually encountered significant selling pressure and the bulls failed to maintain their advantage; a cross star with a long lower shadow line appears at the end of a downward trend, which means that the price once continued to dip, but was quickly pulled back by buying orders, and the power of the shorts began to weaken.
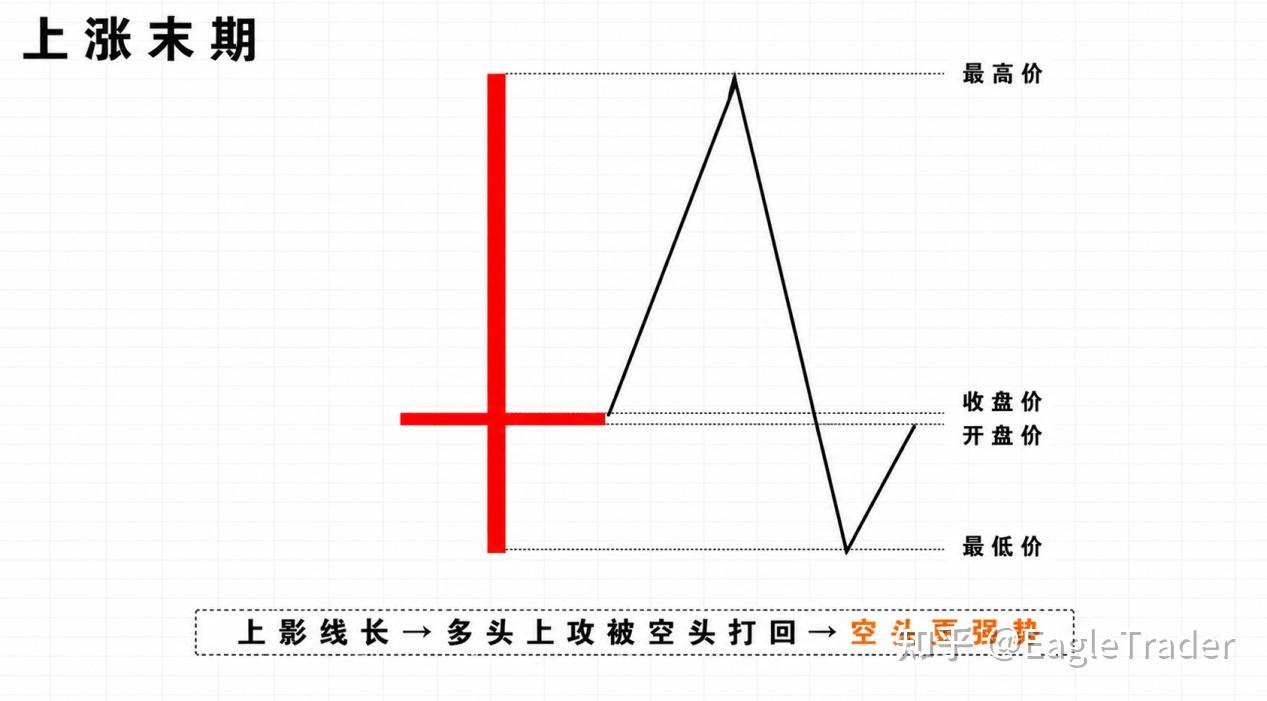
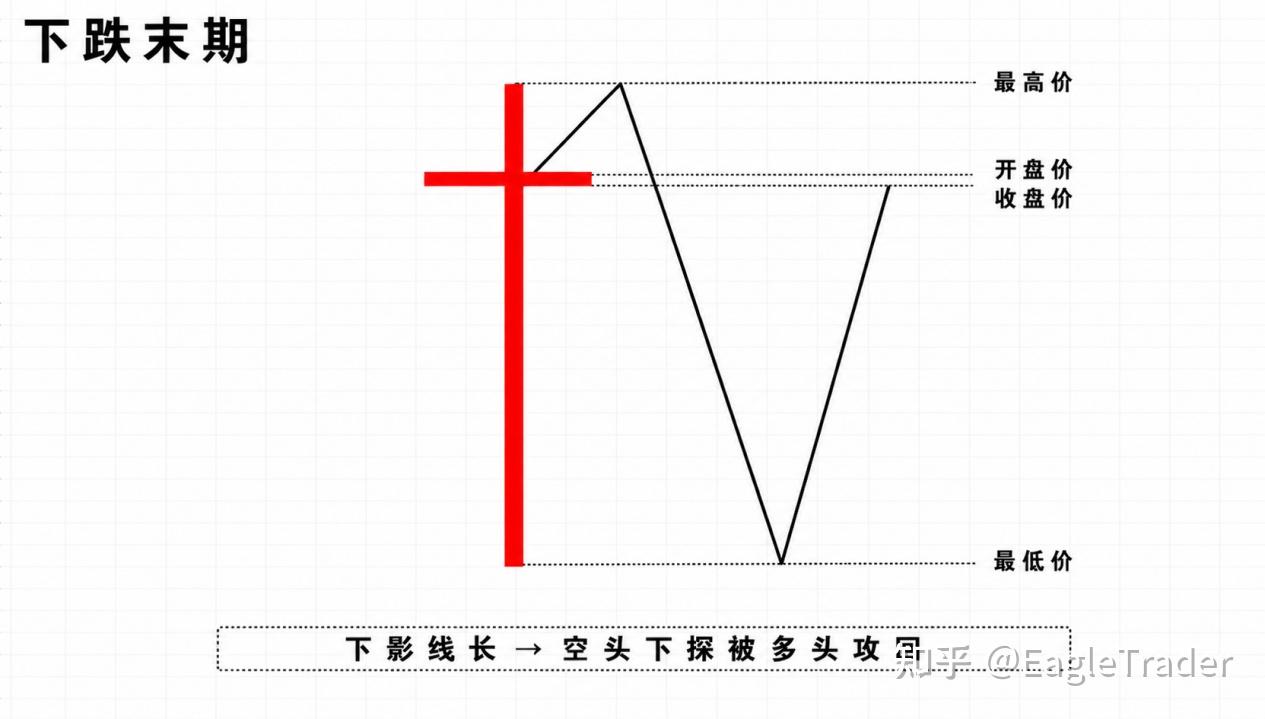
The longer the shadow line, the more intense the competition between the long and short parties, and it also means that the market may be in the direction selection stage.
Of course, the cross star does not have a fixed shape. As long as the entity is small, it is part of the cross star family. There is no need to be too rigid in the standard graphics.
Step 3: Wait for market confirmation
The biggest misunderstanding among many traders is to enter the market immediately when they see the cross star. In fact, the cross star only prompts the market to enter the hesitation stage and does not tell traders the final direction.
Therefore, a safer approach is to wait for subsequent K-line confirmation. If a trend K line with a larger entity and clear direction appears after the cross star, it means that the market has re-formed a new balance of power. At this time, formulating entry and exit strategies based on the trading plan is often more valuable than predicting the direction in advance.
Rather than being ahead of the market in guessing the market, it is better to wait for the market to give its own answer.
The more many traders learn, the more “opportunities” there are on the market. Look at the cross star today, look at the engulfing pattern tomorrow, and pay attention to various indicators the day after tomorrow. In the end, it is easy to fall into hesitation due to too many signals, and even conflicting judgments.
In fact, for mature traders, the cross star is only an auxiliary signal in the trading system, not an independent trading basis.
Only by combining trend analysis, key positions, risk management and execution discipline can technical forms truly exert their due value.
In EagleTrader’s view, establishing a trading system that is stable and capable of long-term execution is more important than mastering more technical forms. Because the cityThe market will never lack trading signals. What truly determines long-term performance is whether traders can adhere to their own trading rules and execute them continuously and stably.